 |
| Detail Report The Detail Report identifies individual specifics for each lease in Texas and the individual monthly components for each lease. Each Detail reports the lease name, the RRC lease number, the Field, the Operator and the Gatherer(s) of the commodities from the lease. The user may “filter” data based on crude gravity and unit pricing ranges. Additionally, the Detail identifies each month the amount of commodity sold, the average price paid, who each producer sold their commodity each month and the unit price for marketing costs. Unique to the Detail Report, the crude and natural gas monthly sales prices is compared to various indices and produces a differential pricing dataset to compare the lease’s price above or below the comparison index, such as the Nymex, Henry Hub, Cushing, and various purchaser WTI Postings. The Detail also identifies how the commodity was transported off the lease, by truck or pipeline, by mainline transmission or plant tailgate. |
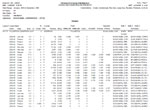 Click Here for Sample Detail Report |
|
| Appraisal Report The Appraisal Report summarizes the commodities for a given time period based on the user’s selection criteria. The Appraisal is similar to the Summary Report except that this report summarized entire sets of data based on the date range selected, instead of individual monthly sets of data. The Appraisal produces a summarized volume, an Average Price, a Median Price, a High Unit value reported during the date range, a Low Unit value reported during the date range, and the Gross Value of the commodity during the date range. First, the user selects the Date range to summarize. Second, the user selects the set of display criteria to summarize, such as all Commodities from a single County. The user could then add further selection criteria for the same or multiple County(ies) by summarizing the data for a single Commodity type, or for all Purchasers, or for all Producers, or for all Operators, or for all Gatherers, or for all Fields. The power of the Appraisal Report is limitless in its flexibility for user-selected criteria. |
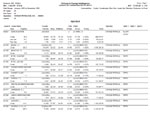 Click Here for Sample Appraisal Report |
|
| Effective Tax Rate The Effective Tax Rate Report calculates the “Net Effective Tax Rate” for each lease and the lease type of each lease for each month’s reporting period. Each Effective Tax Report details the lease name, the RRC lease number, the Field, the Operator and the Gatherer(s) of the commodities from the lease. Additionally, the Effective Tax Rate identifies each month the amount of commodity sold, the average price paid, who each producer sold their commodity each month, the type of lease for each month, the gross volume for each lease type, the gross value, the marketing costs, the exempt values, and the net taxable value for each lease type each month. Finally, the Effective Tax Rate calculates the net effective tax rate for each lease type each month. The report is an excellent resource for confirming proper lease type filing each month, proper filing of the marketing costs and exempt costs, and a visual calculation of the actual net effective tax rate for each lease type filed each month. |
 Click Here for Sample Effective Tax Rate Report |
|
| Marketing Report The Marketing Report summarizes data from multiple individual leases and calculates summarized volume, Average Unit price, and Median Unit price. The report summarizes data based on the user selected date range, the Field criteria, the County criteria, the Purchaser, and the Producer sales. The report allows the user to select the display criteria based on Commodity type, Field location, County, as well as sorting based on the Producer or the Purchaser. This powerful report is an excellent resource for marketing efforts where individual lease criteria is not needed, but rather the summarized data from multiple leases within user designated geographic criteria. |
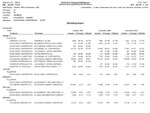 Click Here for Sample Marketing Report |
|
| Market Share The Market Share Report calculates the amount of market share a giver Purchaser or Producer has in a user specified geographic area. The report summarizes a Purchaser’s or Producer’s geographic data by Commodity type, the volume sold, the gross value sold, and calculates the average unit price, based on the user selected date range for calculation. Additionally, the Market Share calculates the number of months within the user selected date range in which the Purchaser or the Purchaser participated in sales of the Commodity. This report is excellent in viewing how much market share a given Purchaser or Producer controls in a user specified geographic area. |
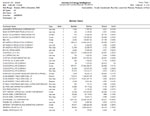 Click Here for Sample Market Share Report |
|
Monthly OverviewThe Monthly Overview Report summarizes macro level data on a monthly basis, by commodity type, based on the user-selected criteria. The Report produces a summarized monthly volume, an average daily production volume, an Average Price, a Median Price, a High Unit value reported during the date range, a Low Unit value reported during the date range, a differential price against various indices of Nymex, KochWTI, and Cushing WTI, plus the Gross Value of the commodity during the date range. Uniquely, the Monthly Report also calculates the Standard Deviation of each commodity type for use in financial analysis of marketing efforts. |
 |
|
| Summary Report The Summary Report is similar to the Appraisal Report, but provides monthly data in the same format as the Appraisals Report. The Summary produces a monthly-summarized volume, an Average Price, a Median Price, a High Unit value reported during the date range, a Low Unit value reported during the date range, and the Gross Value of the commodity during the date range. First, the user selects the Date range to summarize. Second, the user selects the set of display criteria to summarize, such as all Commodities from a single County. The user could then add further selection criteria for the same or multiple County(ies) by summarizing the data for a single Commodity type, or for all Purchasers, or for all Producers, or for all Operators, or for all Gatherers, or for all Fields. The power of the Summary Report is limitless in its flexibility for user-selected criteria. |
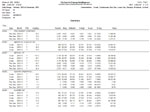 Click Here for Sample Summary Report |
|
| Regulatory Report The Regulatory Report is uniquely designed to assist Severance Tax filers track filings made with the Texas Comptroller. The report identifies the RRC Lease number, the lease name, County name, Lease type, commodity, purchaser and producer tax identification numbers and names, plus the Regulatory Report computes the Comptroller required Regulatory Lease filing number complete with check-digit calculations. |
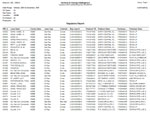 Click Here for Sample Regulatory Report |
72.167.35.76 1628772639